CONTENTS
Obtaining a heap dump
Running the tool
Understanding the output
Most important issues
Top-level stats
Thread throwing OutOfMemoryError
Where memory goes
Where memory goes, by class
Where memory goes, by GC root
Live vs garbage objects
Fixed per-object overhead
Memory retained by objects awaiting finalization
Memory waste due to specific problems
Duplicate strings
Bad collections
Bad object arrays
Bad primitive arrays
Boxed numbers
Duplicate objects
Duplicate primitive arrays
Duplicate object arrays
Duplicate lists
WeakHashMaps with hard references from values to keys
Off-heap (native) memory used by java.nio.DirectByteBuffers
Humongous (bigger than 1MB) objects
Heap size configuration
Very long reference chains
Thread stacks
System properties
OBTAINING A HEAP DUMP
JXRay Memory Analyzer analyzes binary heap dumps, which are essentially JVM memory snapshots. There are two main methods of obtaining heap dumps. To get a dump from a running application, invoke the jmap utility that comes with the JDK:
> jmap -dump:live,format=b,file=myheapdump.hprof <target JVM pid>
For more information, run jmap -help or read its online documentation.
The JVM can also generate a heap dump automatically if your application fails with OutOfMemoryError. To enable this, add the -XX:+HeapDumpOnOutOfMemoryError flag to the target JVM command line. See the relevant HotSpot JVM documentation for more details. If your app crashes with OOM, a heap dump obtained in this way is the most useful, since it reflects the contents of your application’s memory when the problem occurred. This helps to expose the data structures taking most memory, that should be optimized first.
Android produces heap dumps in its own format. To convert an Android heap dump into the common .hprof format, that’s readable by JXRay and other tools, you can use the hprof-conv tool provided in the Android SDK, for example:
> hprof-conv dump.hprof dump-converted.hprof
For more information, check out this article
RUNNING THE TOOL
To run JXRay, invoke the jxray.sh script from the command line like this:
> jxray.sh myheapdump.hprof
The tool will generate a report with the same name as the heap dump file, and .html extension, i.e. myheapdump.html in the above case. You can override the default report file name by providing your own, e.g. myreport.html.
The script expects that the JDK bin directory is on your PATH. Alternatively, you can specify the JDK location to the script via the JXRAY_JAVA_HOME environment variable, that should point to your JDK’s root directory. To adjust the JVM settings (e.g. if your dump is very big and you need to give the JVM running JXRay more memory), you may either
- use the environment variable JXRAY_JAVA_FLAGS, for example JXRAY_JAVA_FLAGS=”-Xms30g -Xmx30g” ; jxray.sh myheapdump.hprof
- Pass the JVM flags directly to the script using the -J prefix, for example jxray.sh -J-Xms30g -J-Xmx30g myheapdump.hprof myreport.html
You typically need to set -Xmx at least the same as the size of the dump file. For better performance, a higher value (between 1.3x .. 1.7x the size of the analyzed heap dump) is recommended. That’s important if your disk is slow and/or the dump contains a large number of small objects. It is also advised to use a machine with at least 4 CPU cores. 8 CPU cores are recommended for optimum performance, and a bigger number may further improve speed for very big dumps.
For some dumps JXRay memory requirements may be relaxed. The rule of thumb is that the better a heap dump compresses with zip or gzip, the less memory is needed to analyze it. For (rare) heap dumps that get compressed by a factor of 10 or so, JXRay can run with a heap that’s smaller than the dump file size. That’s because such dumps tend to contain mostly duplicate objects or empty/semi-empty arrays. This means that the amount of information that JXRay has to keep while processing the dump is smaller than usual.
The output of JXRay goes to the specified file in HTML format. You can also use the -email command line flag to make the tool send the report to the specified address. For that to work, your machine should have the /bin/mail or /usr/bin/mail utility configured properly.
JXRay has a number of other command flags that are useful in special situations. You can learn about them by invoking jxray.sh -help
One flag that you may find useful occasionally is -extra_classes <class1,[class2,...]> It allows you to specify one or more classes that the tool would not report otherwise, since their instances take too little memory (less than 0.1% of the heap). In most situations such classes are not interesting and would just clutter the JXRay report. However, when debugging certain problems, you may need to know how many instances of some small, but important class are present in memory, what values they contain, etc. That’s when this flag comes handy.
UNDERSTANDING THE OUTPUT
A report generated by JXRay for the given heap dump has many sections. When you first open the page, all sections except the topmost one are collapsed to avoid clutter. You can click on the small black triangle to the left of the section title to expand and view the given section. Within most sections, many more things can be expanded and then collapsed back.
Each section is devoted to a specific heap metrics or potential problem. Whenever possible, the tool reports the overhead (waste) associated with the given problem, in Kilobytes and as a percentage of the used heap size, for example “560,810K (31.4%)”. The overhead is how much memory you could save in the ideal case, if you completely eliminate the given problem.
Most important issues
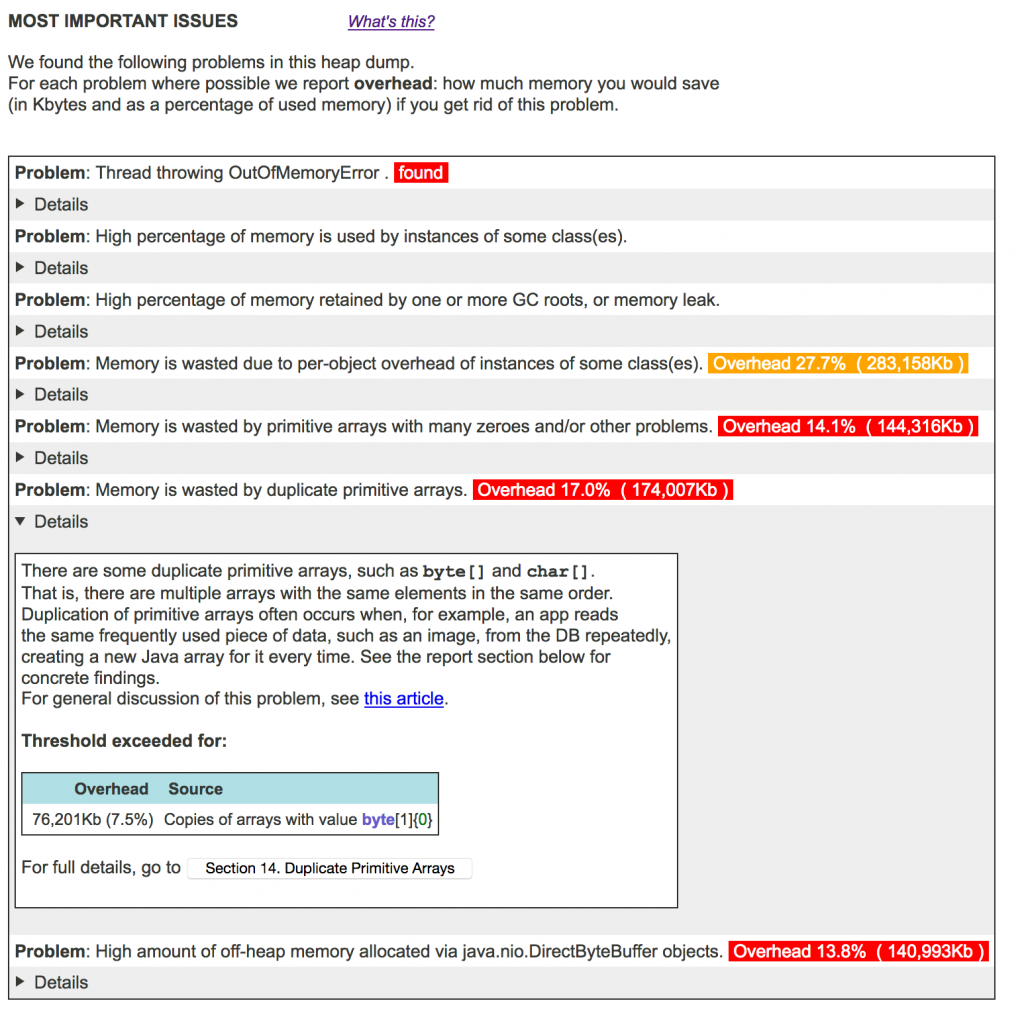
The topmost part of the report tells you if your dump has any serious issues. Only problems with overhead greater than a certain threshold are listed here. When the overhead (and thus impact) of some problem is really high, it is highlighted in yellow or red. Clicking on the “Details” line opens a quick explanation of the problem and highlights the biggest specific sources of waste. Full details of each problem are provided in the corresponding section later in the report.
Top-level stats
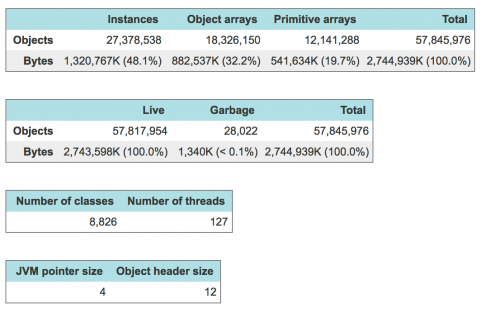
This section presents the total number and size, in Kbytes, of all objects in the heap, as well as a breakdown by object type (instances vs object arrays vs primitive arrays) and live/garbage status. A dump may contain a lot of garbage if it was collected using jmap without the ‘live‘ flag. If you are concerned about a memory leak or reducing memory footprint, it’s better to obtain a “live” heap dump using ‘jmap -dump:live...‘ command. This command forces the JVM to run Full GC before generating a dump, and thus live dumps contain no or almost no garbage. A heap dump with garbage (“full dump”) is more difficult to analyze, since garbage objects obscure the live ones, which are usually more important. Furthermore, many garbage objects may be short-lived. Such objects usually have small or near-zero negative impact on GC pauses. Thus a heap dump with garbage is typically worth analyzing only when you suspect that some objects become garbage relatively late in their life. Such objects, that are neither short-lived nor long-lived, cause most GC problems, and heap dump analysis may tell you how many of them you have and where they come from.
It’s worth checking the number of classes and number of threads: very high values may signal a leak. If there are over ~20,000 classes, it may be caused by multiple classloaders that load the same class file(s) many times, or by auto-generating class files. Ultimately with too many classes the JVM’s internal memory limit (PermGen size in JDK 7 or metaspace size in JDK 8+) would be exceeded, causing an OutOfMemoryError.
A very high number of threads (more than a few hundred) is, for one thing, impractical: all these threads cannot run in parallel unless you have the matching number of CPU cores. Typically an excessive number of threads is created by third-party I/O libraries, and most of these threads sleep most of the time. However, if the number of threads reaches ~1,000, it is very likely a leak. It needs to be addressed, since otherwise the application may hit the OS per-process thread limit and fail with OutOfMemoryError.
If any thread threw an OutOfMemoryError when this dump was generated, its stack trace is shown in this section as well.
Thread throwing OutOfMemoryError
If a heap dump was generated by the JVM after anOutOfMemoryError, the stack trace of the thread that threw this exception is displayed here. If any stack frame contains local variables, they are presented in an expandable subsection. This is especially useful if an OutOfMemoryError was thrown not because the heap was too small, but because an array bigger than the JVM internal limit (2G elements) could not be allocated. Checking the contents of this and other data structures on the stack helps you to determine the root cause instantly.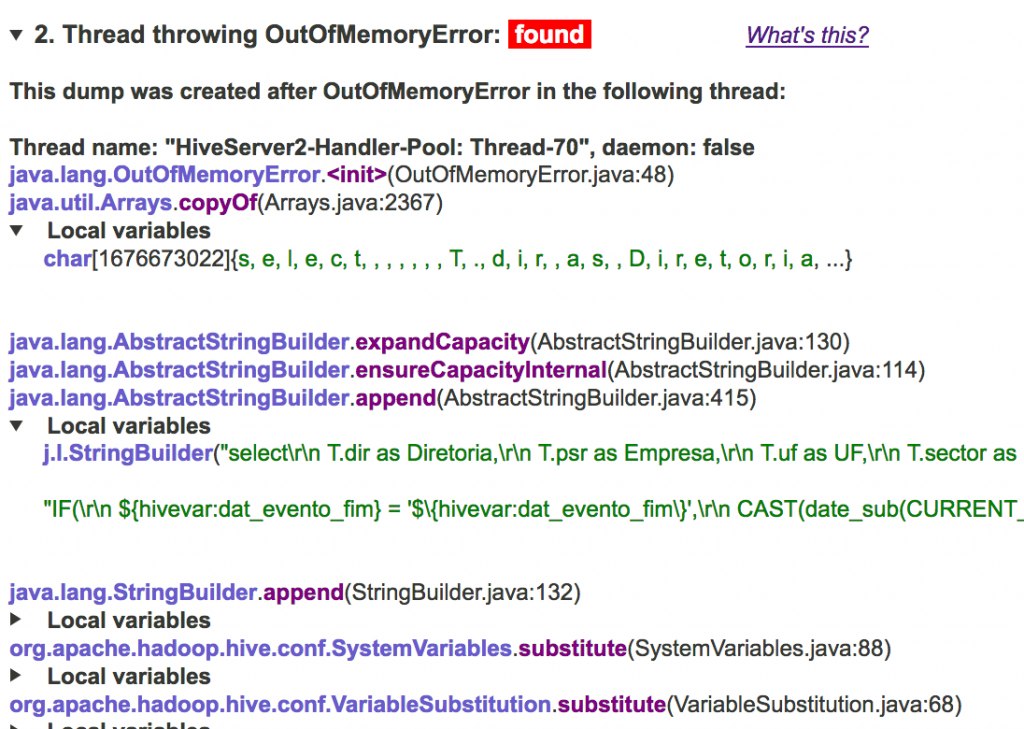
WHERE MEMORY GOES
The next few sections help you understand where memory goes: instances of what classes take memory (object histogram), what GC roots and reference chains hold all these objects in memory, how much memory and how many objects are live vs garbage, how much memory is used by object headers (rather than the useful data that’s stored in objects), etc.
Where Memory Goes, by Class
This section, also called object histogram, gives a breakdown of memory used by every class taking 0.1% or more of the used heap space. The same 0.1% rule is generally used in other sections as well; this value is adjustable via the -min_reported_percent command line flag. For each class the report displays:
- the number of instances
- how much memory they occupy, in shallow and implementation-inclusive form
- total retained memory for all instances of this class.
By default, the table is sorted by impl-inclusive size, but you an sort it by any other column by clicking on the column header.
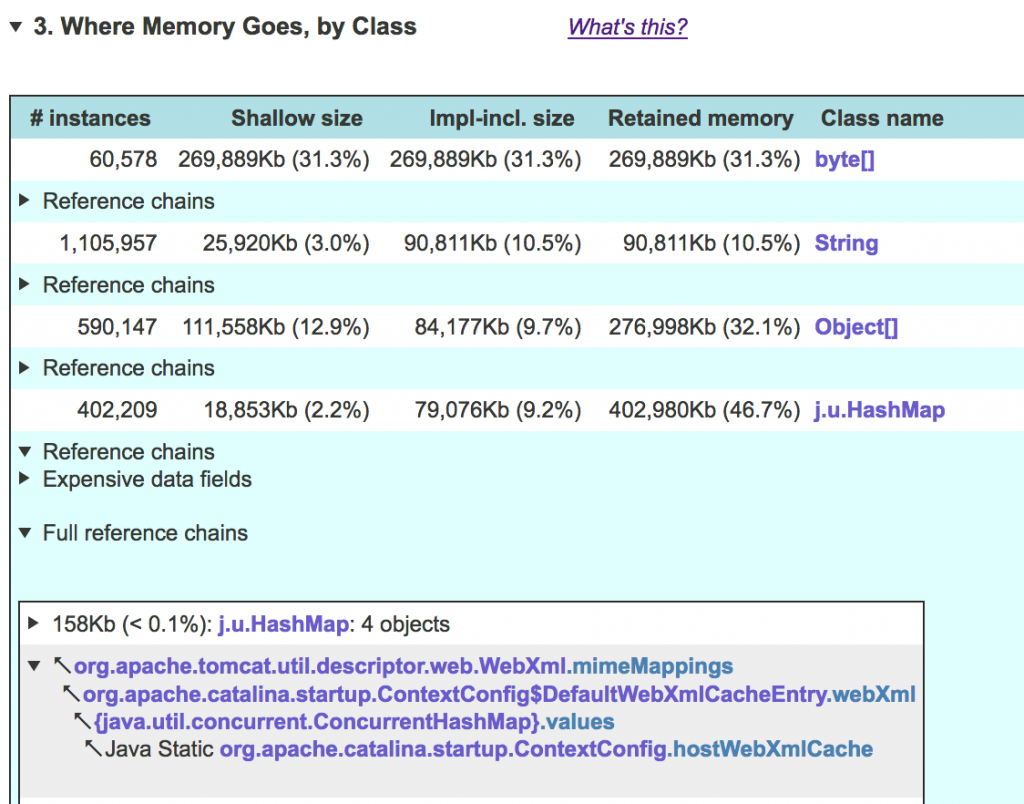
As you can see, shallow and implementation-inclusive size is the same for byte[] (as well as int[] and other primitive) arrays, and for most other objects (not shown here). However, these sizes are different for HashMaps (as well as other collections that JXRay knows about), and String, StringBuilder, and StringBuffer. That’s because each collection is comprised internally of a number of objects. For example, every HashMap instance references a number of implementation objects: the table array backing the HashMap, a HashMap$Node object for each key-value pair, etc. Similarly, a string is technically two objects: an instance of String class itself (that’s what shallow size is for) and a char[] or byte[] array containing the string contents. The (variable) size of that array, together with the fixed String instance size, is the implementation-inclusive size. For HashMap and other collection types, the shallow size is the size of the “naked” HashMap instance, whereas implementation-inclusive size adds the size of all the implementation objects backing this collection (but not the collection contents!). Finally, for Object[] arrays and certain other classes, the situation is the opposite: since Object[] arrays are used in implementation of some collections, e.g. ArrayList, the implementation-inclusive size for them, calculated according to the same rules, is smaller than the shallow size.
The fourth column is retained memory. For objects of the given class C, it is the memory used by instances of C plus all the objects referenced directly and transitively by these instances. This metric is especially useful for classes such as java.net.URI, that “exclusively own” the objects that they reference (e.g. String host, protocol, etc.) For such objects, direct retained memory is their practical footprint.
If you want to find out where instances of the given class “come from” – that is, what data structures hold them in memory, all the way down to GC roots – you can click on the “Reference chains” line. That will open a subsection with all the reference chains leading to groups (clusters) of same-type objects (HashMap instances in our example above). An object cluster, by definition in JXRay, is a group of objects of the same type, all reachable via the same reference chain. Generally, only clusters that take at least 0.1% of the used heap are displayed.
One powerful feature of JXRay is that it “coalesces” (aggregates) all objects that are reachable via the same reference chain, i.e. objects in each cluster. The intermediate objects in the reference chain itself are aggregated too. For example, there are clearly several/many references to values in the ConcurrentHashMap above, but each leads to a HashMap object via an identical reference chain. In aggregated reference chains, the repetitive details that would otherwise clutter the output (e.g. multiple almost identical WebXml instances in the example above), are removed. The remaining, distilled information allows you to see immediately what code is responsible for holding given objects in memory.
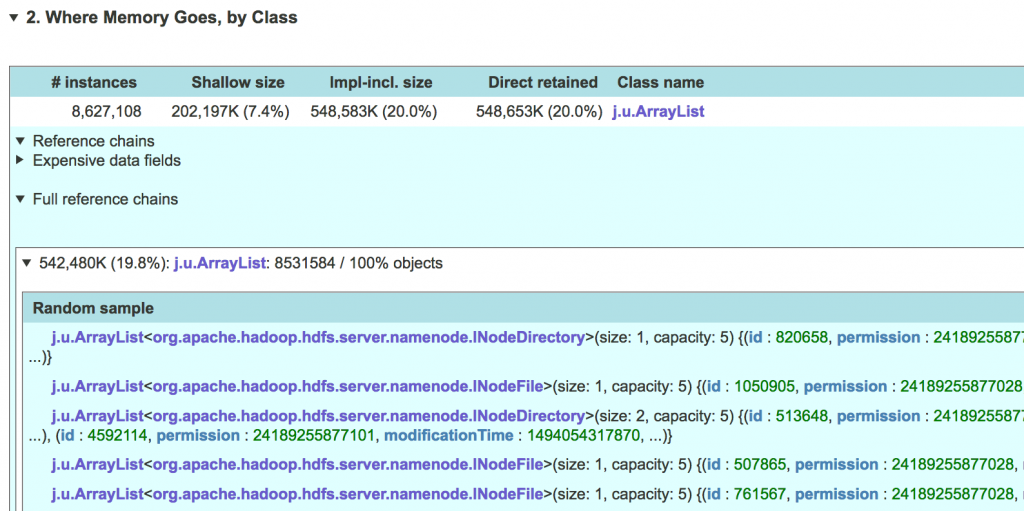
To give you better visibility into objects in the specific cluster, JXRay presents a random sample. You can open this sample by clicking on the line above the reference chain, with the class name, number of objects, etc. Sometimes a sample can be a revelation, as in the example below, where it turns out that most ArrayLists in the given cluster are very small. When practical, JXRay prints the contents of objects (or the first few elements for collections).
JXRay is able to further aggregate and distill reference chains, showing you the “Expensive fields”. Quite often there are two or more different reference chains that end with the same data field, for example:


JXRay aggregates the above two reference chains (plus some more, where each individual one retains just a small number of objects), and presents the result as

When many long reference chains ending with LiteralByteString.bytes are joined in this way, it becomes clear that this class/field is responsible for pretty high used memory.
Where Memory Goes, by GC Root
The information in this section helps you understand what object trees consume a lot of memory and/or cause memory leaks.
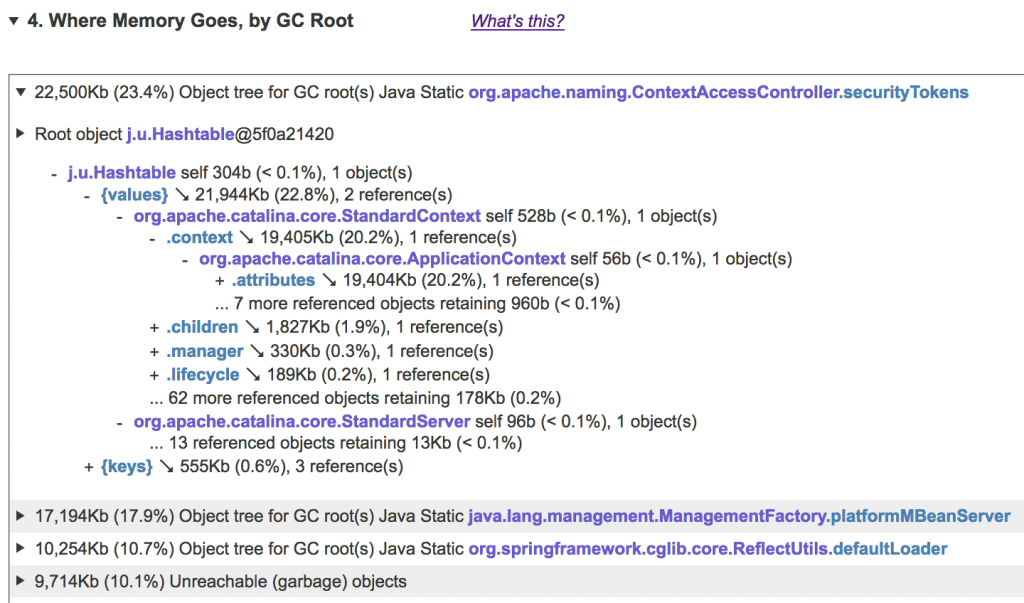
To answer the “who holds all these objects in memory” question, we need to be able to track the reference chains from GC roots to all objects. GC roots are the objects that are not referenced by any other objects but rather by the JVM itself, that hold all live objects in memory. Examples of GC roots are static data fields, local variables in currently active methods, etc. To reveal object trees, JXRay scans the objects in the dump starting from GC roots. If some object is reachable from several roots, the priority is given to (a) the more informative root, such as a static field as opposed to an anonymous JNI reference, and (b) a shorter reference chain. Once the entire object graph has been scanned, the tool groups all objects by their respective GC roots and presents them as trees. In these trees, each node represents either
- one or more objects reachable from the given root via the given reference chain. For example the
Hashtableand theStandardServerobjects on the figure below. The object’s class, number of objects and its “shallow” (self) memory is displayed. - one or more references from the above object(s) to other objects. Such references can be map keys and values, list and array elements, and object data fields. The total amount of retained memory and the number of directly referenced objects is displayed for each reference. References that retain less than 0.1% of the heap are displayed as a single “… N more referenced objects retaining…” item to save space and reduce noise.
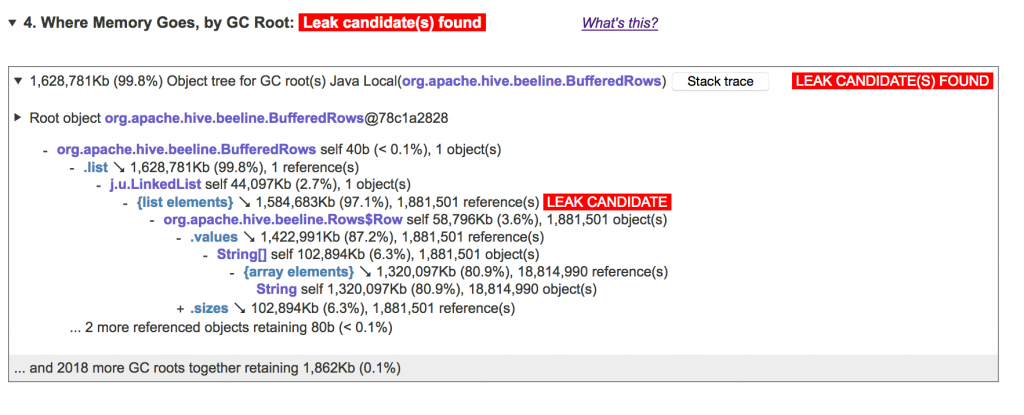
If the object tree contains some object X (collection or array) that points to a much larger number of other objects, that in turn retain a large enough portion of the heap, then X is labeled as a memory leak candidate. Steadily growing leaks, such as an unbounded object cache to which objects are added but never evicted, almost always exhibit such a memory pattern. But even if your app does not have a memory leak, a structure with a very high number of “children” that holds a lot of memory may signal that there is something to optimize in your code.
To learn more about Java memory leaks and detecting them with JXRay, check out the Detecting Memory Leaks from a JVM Heap Dump article.
If there are any garbage objects in the heap dump, all of them are presented in this section under a single “Unreachable” pseudo-root.
Live vs. Garbage Objects
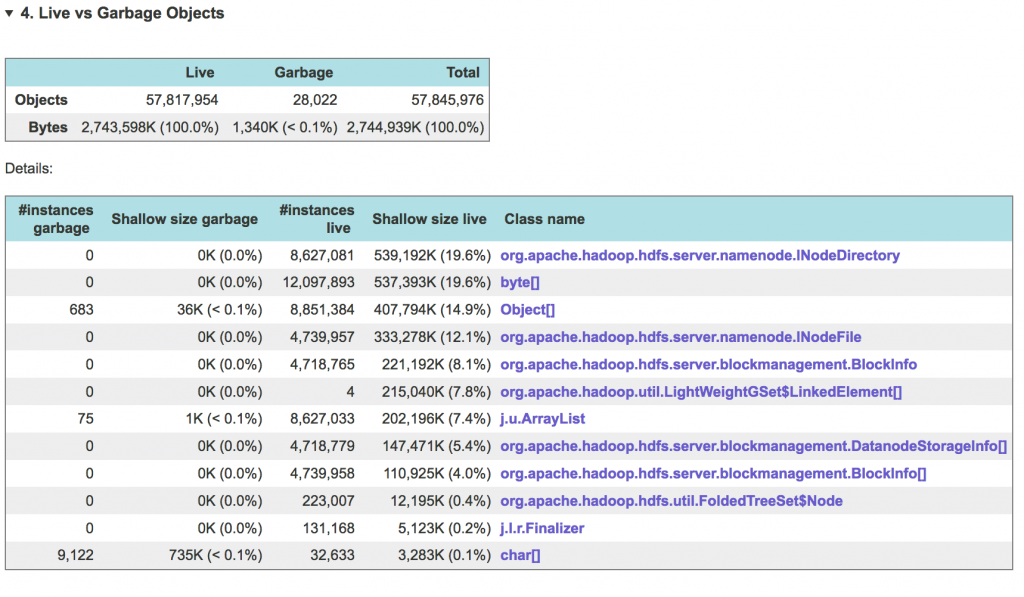
When JXRay scans the heap dump, it determines, for each object, whether that object is live (reachable) or garbage (unreachable). The table in this section presents aggregated information for all objects. Types are sorted by the total live size of their instances. Note that in this section the tool uses only shallow size for each type (no implementaiton-inclusive size, as in the “Where Memory Goes, by Class” section). This is due to the fact that when collections and Strings become garbage, some of their implementation objects may be GCed and some not, leaving the remaining garbage data structures in inconsistent state. That, in turn, would not allow the tool to accurately determine implementation-inclusive size of such garbage objects.
Example:
Fixed per-object overhead
Each object in the JVM memory has a header – essentially a JVM-internal record that contains a pointer to the object’s class, bits used by the GC and synchronization locking mechanisms, etc. Object header is not small: its size varies between 8 and 16 bytes depending on the JVM execution mode (32-bit or 64-bit), with additional “narrow pointer” vs. “wide pointer” modes for the latter. An array uses additional 4 bytes to designate its size. If your application creates a large number of small objects – those with “payload” of a few bytes – the total size of headers of these objects compared to the amount of useful data that they carry, can become really large.
Example:
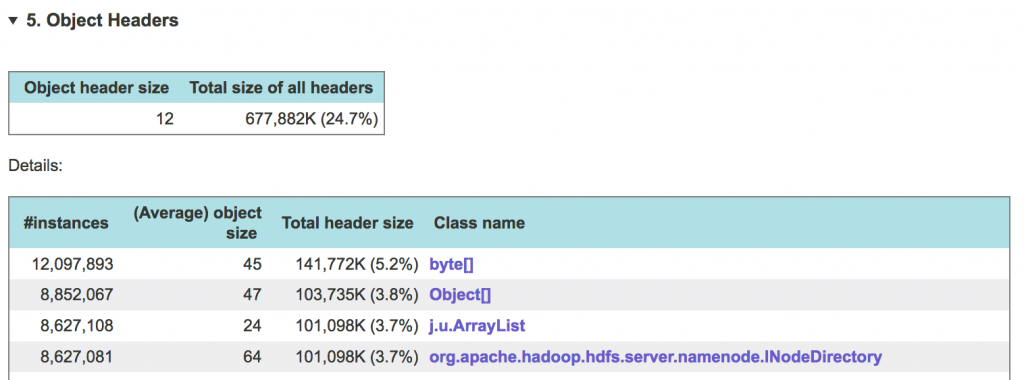
For more information on what can cause large per-object overhead and how to avoid it, check out the What’s Wrong with Small Objects in Java article.
Memory Retained by Objects Awaiting Finalization
Any class can override the finalize() method of java.lang.Object to perform cleanup and similar operations on an instance before it gets garbage collected. This causes objects that are garbage from the application’s standpoint (they are not reachable from any GC roots anymore) to stay in memory until their finalization is complete. In some situations – for example, when a very large number of “finalizable” objects are being created by the application all the time – the single finalization thread may be unable to keep up. Another rare, but real problem is the finalize() method that gets blocked or deadlocked. In this case, the whole finalization thread is blocked and the number of unfinalized objects keeps growing, causing a memory leak.
The JVM puts all unfinalized objects into a single queue, with the root at java.lang.ref.Finalizer.queue static field. If objects reachable from this root take a significant enough amount of memory, they will be presented in this section.
MEMORY WASTE DUE TO SPECIFIC PROBLEMS
Each of the following sections is devoted to a specific problem, that can potentially be fixed by making changes to the code. In each section, the first part shows the impact of a specific problem, such as duplicate strings or suboptimal collections, and presents the top offending objects or types (for example, string values with the highest number of copies). The second part of the section presents reference chains that hold the problematic objects in memory.
Duplicate Strings
This is one of the most common memory problems observed in Java applications. Duplicate strings, that is, multiple separate String objects with the same logical value, such as “FILE: Number of large read operations” in the example below – are often created when a lot of data is read from external sources, e.g. a database. If such strings are retained for long time, and/or each of them is big, they may waste a lot of memory and add GC pressure. Getting rid of duplicate strings typically requires adding special “deduplication” code. The most common way is via the String.intern() method. It’s best to add this call where duplicate strings are generated, or where these strings are assigned to permanent data structures (e.g. in constructors).
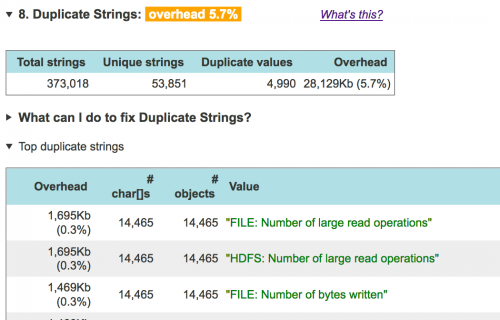
To get suggestions on how to modify the code to address each concrete problem with duplicate strings, click on the “What can I do …” link:
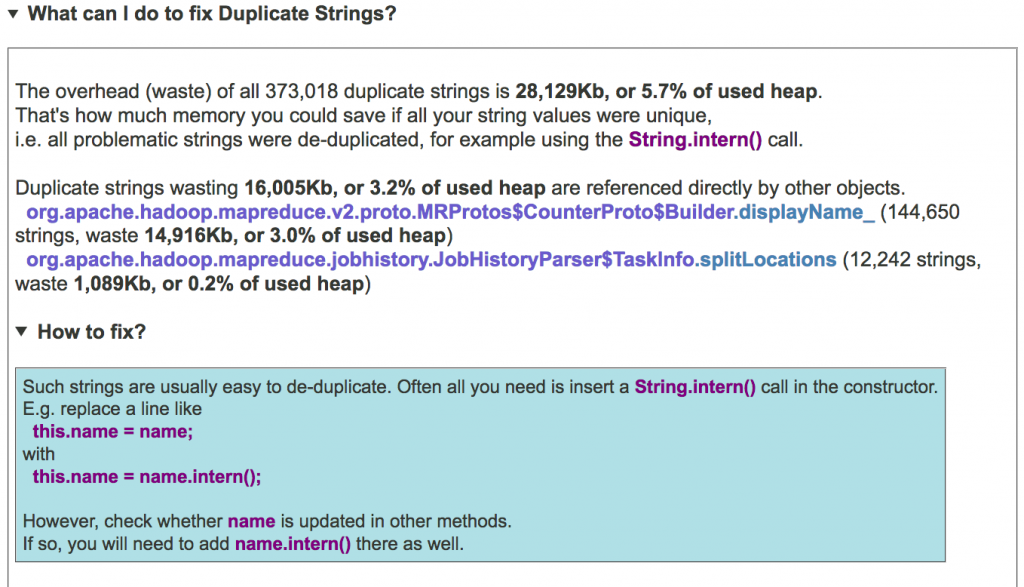
In the subsection that follows, JXRay presents the familiar reverse reference chains leading to the biggest clusters of duplicate strings. When the problematic objects are unreachable (garbage), it attempts to find clusters of similar live strings – they may give you a clue about the source of such strings.
In the example below, 13,885K, or 2.8% of the used heap, is the overhead (waste) due to the duplication of strings reachable via the reference chain unfolded below. That is, if we interned all these strings, our heap usage will be reduced by 2.8 per cent. The number 134660 is the number of duplicate strings referenced by this reference chain, and 100% is the percentage of strings that are duplicate, relative to all the strings reachable via this reference chain. In this case, all the strings have duplicates. The “(10 unique)” means that if all the copies were eliminated, we will see only 10 unique strings here. If you click on this line, it will expand, presenting a table with several specimens of the duplicate strings in this cluster.
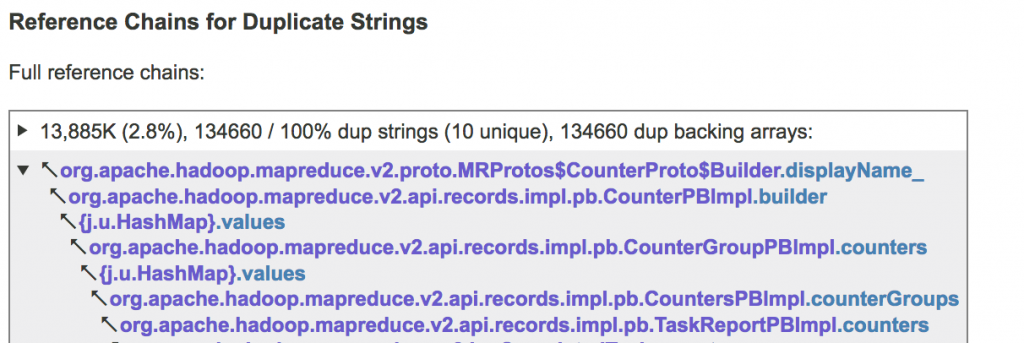
To learn more about duplicate strings and how to change the code to eliminate them, check out the Duplicate Strings: How to Get Rid of them and Save Memory article.
Bad Collections
Java and Scala standard collection classes, such as java.util.ArrayList, java.util.HashMap etc., are very useful. However, applications may sometimes abuse them, resulting in wasted memory. JXRay currently recognizes the following problems with collections:
Empty collections are those that are initialized but don’t contain any elements (workload). Their overhead is defined as the size of the entire collection implementation. It can be really high, varying between around 100 bytes for an ArrayList to 500..1000 bytes for complex structures like ConcurrentHashMap. Empty collections are usually easy enough to avoid with the help of some additional code that allocates collections lazily and performs null checks where necessary.
Single-element collections contain only one element. Their overhead is defined in the same way as for empty collections. If in some place in the program all collections contain only one element, you may find that there was a mistake there, and you can simply replace a collection with a direct reference to the object. Otherwise, i.e. if for some legitimate reason most of the time most collections, e.g. ArrayList<Foo>, have only one element, but sometimes may contain several, you may implement custom code that replaces the ArrayList x data field with Object x. Then, depending on the number of objects to store, this code would set x to point to either a single Foo object or to an ArrayList.
Small collections are, by definition in JXRay, those that contain between 2 and 4 elements. Such collections are suboptimal in most cases, since the size of their workload (2 to 4 object elements, i.e. object pointers) is still small compared to the size of the collection implementation. Furthermore, many collections backed by an array by default allocate arrays that are considerably bigger, typically 10 to 16 elements, resulting in even more waste. Note that a hash map with a small number of elements will likely not perform searches and other operations faster than a plain array with handwritten search functionality. Thus if some code in your application manages a large number of small collections such as ArrayLists, it may be worth considering replacing them with plain arrays, that would result in much smaller overhead. At a minimum, it is worth allocating these lists with a small initial capacity: use e.g. ‘new ArrayList(2)‘ instead of ‘new ArrayList()‘.
Sparse collections are those that that use an array internally (for example, ArrayList or HashMap), contain more than 4 elements, and have only 1/3 or less of the internal array slots occupied (non-null). This can happen either if a collection was allocated with initial capacity much larger than needed, or if many elements have been removed from it (most array-based collections never “shrink” when elements are removed). If your application has a large overhead due to sparse collections, consider allocating them with more suitable initial capacity or re-creating them after many elements are removed.
Lists with too many null elements are, by definition in JXRay, those where more than 25% of elements are null. If a list contains a large number of nulls, it is probably a sign of a bug or a suboptimal data structure. In the latter case, you may want to consider changing your code at a higher level to store the same information in a more compact form.
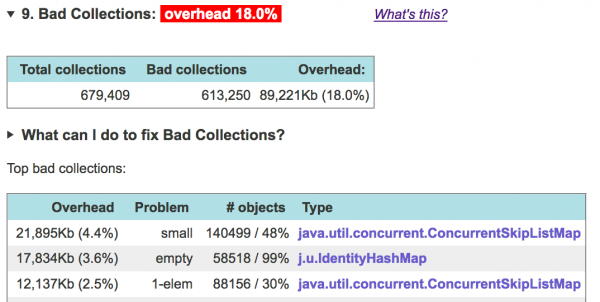
In the above table, the first column is the overhead for the given combination of a collection type (last column) and problem (second column). For example, if we got rid of all empty IdentityHashMaps, we would save 17,834K, or 3.6% of the used heap. The third column shows how many objects of this type have the given problem, and what’s their percentage. That is, 99% of all IdentityHashMaps in this heap dump are empty, and only the remaining 1% are “normal”.
To learn more about suboptimal collections, and changing the code to get rid of them, check out the How to Prevent Your Java Collections from Wasting Memory article. To get concrete recommendations regarding bad collections in your heap dump, click on the “What can I do …” link:
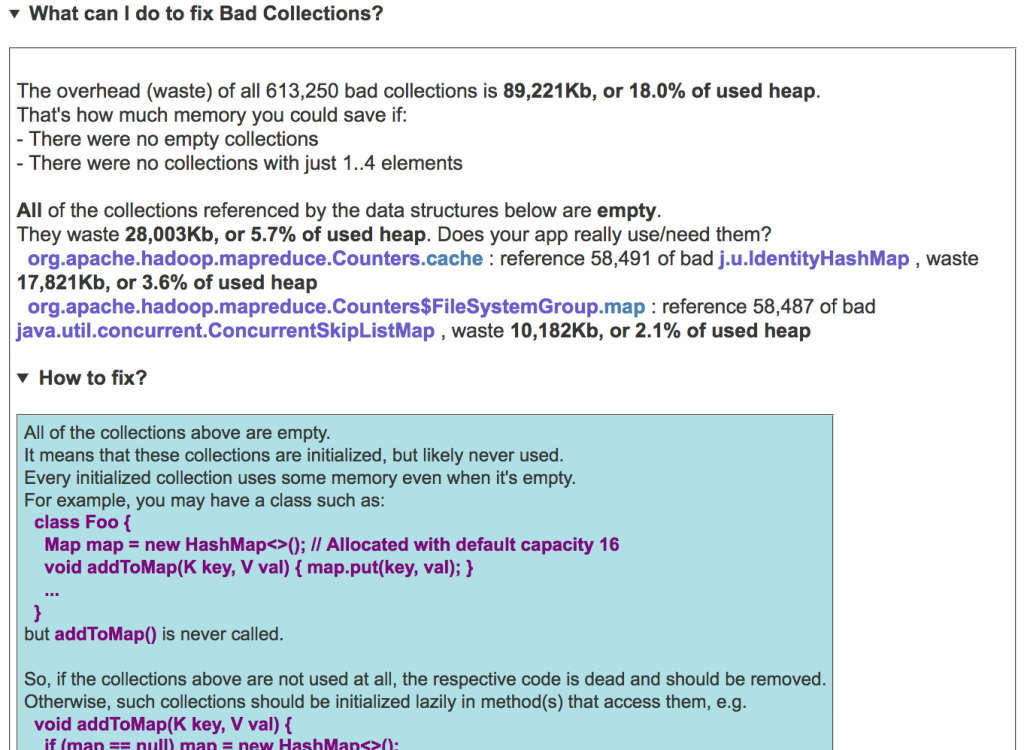
The next subsection, as in all other bad/duplicate object sections, contains the familiar reverse reference chains leading to the clusters of problematic collections.
Bad Object Arrays
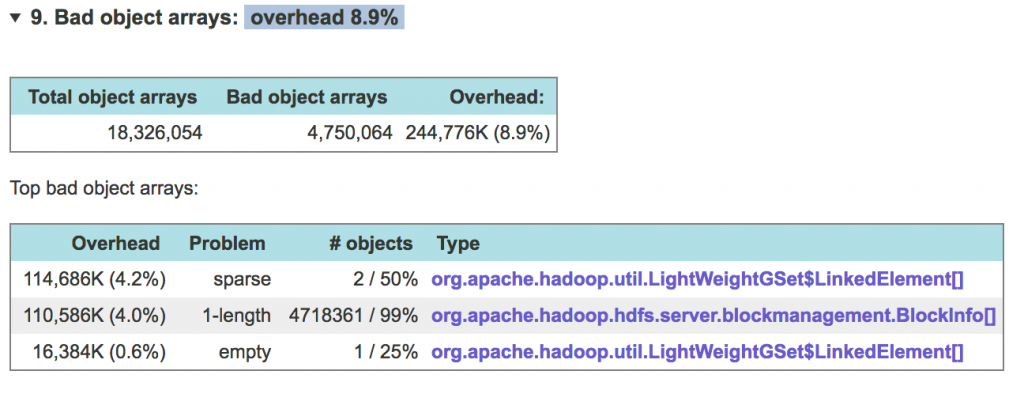
Similarly to bad collections, object arrays of wrong size, or with unused space, result in wasted memory. JXRay currently recognizes the following problems with object arrays:
Empty arrays contain only null elements. Their overhead is defined as the size of the entire array. Empty arrays can be avoided, for example, by adding code that allocates arrays lazily and performs null checks where necessary.
Length 0 arrays are typically created by code that allocates arrays of requested size without checking for zero. Their overhead is defined as the size of the entire array. If your app really needs zero-length arrays for some reason, multiple arrays can be easily replaced with a singleton zero-length array.
Length 1 arrays, whose overhead is also defined as the size of the entire array, can be avoided in the same way as single-element collections. That is, either Foo[] x can be replaced with Foo x, or a more complex solution may be implemented. The latter would replace Foo[] x field with Object x, that would ultimately point either to an array or to a single Foo object.
Single-element arrays, with overhead again defined as the entire array size, are those that have length greater than 1, but contain only one non-null element. They can be dealt with in the same way as length 1 arrays.
Sparse arrays, by definition in JXRay, are those that contain 70% or more of null elements. You may want to consider allocating arrays with smaller capacity, or changing your code at a higher level to store the same information in a more compact form.
Bad Primitive Arrays
Similarly to suboptimal collections and object arrays, primitive arrays of wrong size, or with likely unused contents, cause memory waste. JXRay currently recognizes the following problems with primitive arrays:
Empty arrays are those that contain only zeroes. Their overhead is the size of the entire array. Empty arrays can be avoided using additional code that allocates arrays lazily and performs null checks where necessary. However, in some cases, e.g. with I/O buffers, it’s hard to avoid having some temporarily empty byte[], int[] etc. arrays in memory.
Length 0 arrays are typically created by code that allocates arrays of requested size without checking for zero. Their overhead is defined as the size of the entire array. Multiple length 0 arrays can be easily replaced with a singleton array.
Length 1 arrays, whose overhead is also defined as the size of the entire array, can sometimes be avoided in the same way as single-element collections. That is, int[] x can be replaced with int x. Alternative application-specific solutions might also be possible.
Arrays with a high number of trailing zeroes are, by definition in JXRay, those that have the last 25% or more of elements equal to zero. The overhead of such an array is the size, in bytes, of all the trailing zero elements. Such underutilized arrays are often buffers that have been created too big. The problem with them may be addressed by reducing initial buffer size.
Sparse arrays, by definition in JXRay, are those that contain 70% or more of zero elements. You may want to consider allocating arrays with smaller capacity, or changing your code at a higher level to store the same information in a more compact form.
Zero high bits arrays are those that contain 70% or more of elements with unused (zero) high half. This only applies to integer types taking two or more bytes, i.e. short, char, int and long. For example, an int[] array with zero high bits will only contain elements in the -32,768..32,767 range. If in some array all or most elements have zero high bits, you may consider changing its type to a narrower one, e.g. int[] instead of long[], etc.
The breakdown by problems, and reporting of reference chains for bad primitive arrays is very similar to that for bad collections and bad object arrays.
Boxed Numbers
Boxed numbers are instances of classes such as java.lang.Integer, java.lang.Long etc. Most often they are used because the JDK doesn’t provide collection classes that store plain ints, longs etc. That is, if you want to create a hash map that maps names to numbers, you need to instantiate either a java.util.HashMap<String, Integer> or use third-party libraries.
Unfortunately, a data structure with boxed numbers is a bad choice from the performance standpoint. That’s because, for example, a java.lang.Integer object that stores a 4-byte int occupies between 16 and 24 bytes (depends on whether the JVM runs in the “narrow pointer” or “wide pointer” mode). Plus, there is a pointer to that object that takes 4 or 8 bytes. That is not to mention other effects, like application execution slowdown due to GC pressure, reduced cache locality, multiple memory reads instead of a single one, immutability of boxed numbers (therefore to e.g. increment it you need to create a new object), etc. Thus, if your application’s heap contains many boxed numbers, your best choice is to stop using them, which likely means switching to third-party libraries with data structures that store plain numbers, such as fastutil.
Reporting of boxed numbers in JXRay is similar to that for bad collections and arrays:
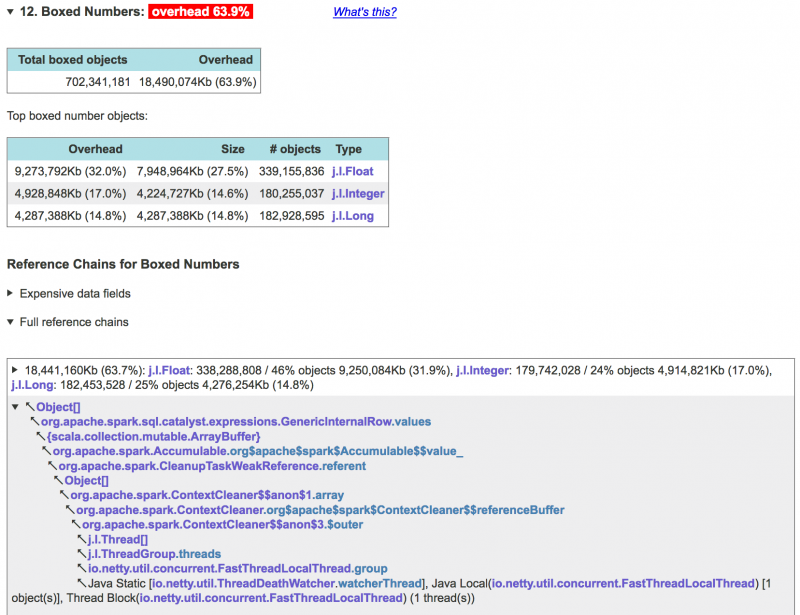
To learn more about boxed numbers and how to eliminate the, check out the What’s Wrong with Java Boxed Numbers article.
Duplicate Objects
Duplicate objects of arbitrary types occur more rarely than duplicate Strings. But when they do, they almost always cause significant overhead. Currently JXRay analyzes only instances of non-collection classes for duplication. The analysis is “shallow”. That is, consider objects A and B that point to identical objects X and Y, respectively. In this case, despite the fact that A and B are logically identical, they will still be considered different, because X and Y are different objects. On the other hand, if both A and B point at the same object X, JXRay will mark them as identical (duplicate). Duplicate objects, if they are immutable, can often be easily eliminated using some form of a canonicalization cache.
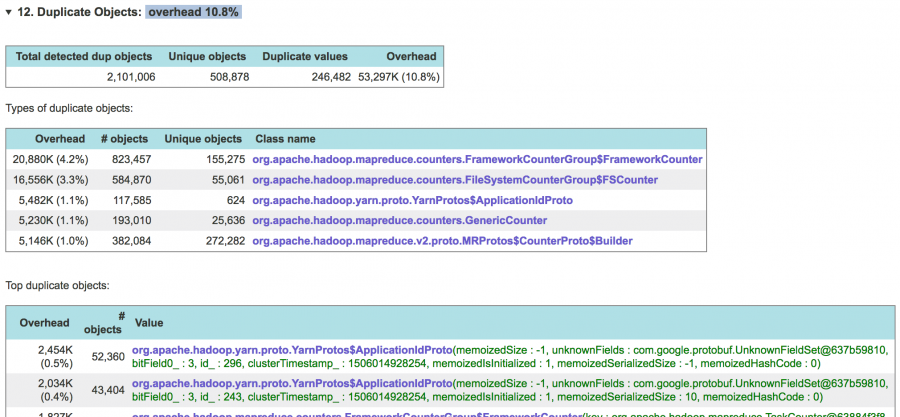
The following subsection provides the standard reference chains leading to clusters of duplicate objects. For each cluster some specimen objects are presented in the same format as in the table shown above:

For more information on causes of object duplication and how to fix it, check out the Duplicate Objects in Java: not just Strings article.
Duplicate Primitive Arrays
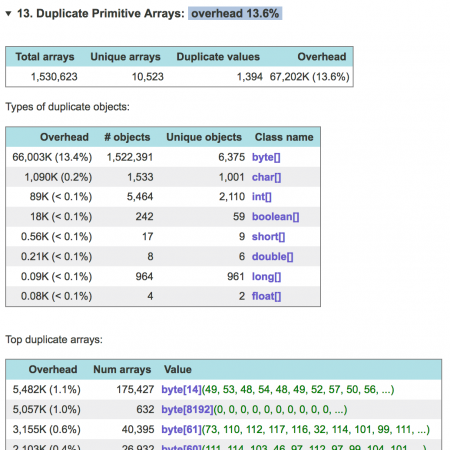
Such arrays are similar to duplicate strings: they are separate objects, but their contents are the same. Note that JXRay is smart and can distinguish between “standalone” char[] arrays and those that belong to String instances – the latter are not analyzed in this section.
Duplicate Object Arrays
Duplicate object arrays are similar to duplicate primitive arrays: they are separate arrays with identical length and contents. Note that when JXRay compares such arrays, it performs essentially bit-by-bit comparison. Thus two arrays are considered duplicate only if both point to the same set of objects in the same order. If, on the other hand, there are e.g. two String[] arrays x and y, such that x references String instances "foo", "bar", and y references another two String instances, that also have values "foo", "bar" – then x and y would not be reported as duplicate arrays.
Duplicate Lists
The way JXRay analyzes array-based lists, such as java.util.ArrayList and java.util.Vector for duplication, is very similar to the way it analyzes object arrays (see the previous section). Thus two lists are considered duplicate if their backing object arrays are duplicate. For two lists that are duplicates the standard equals() method will return true.
WeakHashMaps with hard references from values to keys
In this section JXRay reports instances ofjava.util.WeakHashMap collections where at least some value objects contain references back to key objects in the same map. In general, references from hash map values back to keys in the same map are not uncommon. For example, class Person may have a field name, and it’s natural to have a hash map that indexes persons by their names. However, adding such key-value pairs to a WeakHashMap has the same effect as adding permanent strong memory references to the key objects. The respective keys (and values) cannot be cleaned up by the garbage collector anymore, no matter how high is the GC pressure. In essence, a WeakHashMap with references from values to keys doesn’t work as expected.
When a WeakHashMap with this problem is detected, you should consider changing the value class so that it cannot reference objects that are used as keys.Off-Heap (Native) Memory Used by java.nio.DirectByteBuffers
Almost every Java application uses some memory outside the JVM heap. This is done primarily by the I/O code, since the OS can only read/write memory areas that are outside the JVM heap and thus have stable addresses (within the heap, any object can be relocated at any moment by the GC). The standard way for a pure Java application to allocate native memory is viajava.nio.DirectByteBuffer objects. When such an object is created using the ByteBuffer.allocateDirect() call, it allocates the specified amount (capacity) of native memory through the malloc() OS call. This memory is released only when the given DirectByteBuffer object is garbage collected and its internal “cleanup” method is called (the most common scenario), or when this method is invoked explicitly via getCleaner().clean().
Since each DirectByteBuffer has an internal capacity data field, JXRay can calculate how much native memory is used by all these objects. As usual, the tool presents reference chains leading to all the buffers holding significant amounts of memory (for the objects that are already unreachable (garbage), reference chains ends with “Unreachable”). As explained above, normally the native memory for the given DirectByteBuffer is released only when this Java object gets GCed and disappears completely. Thus whenever you see a DirectByteBuffer in a JXRay report, all the native memory reported for it is still allocated, regardless of whether this Java object is live or garbage.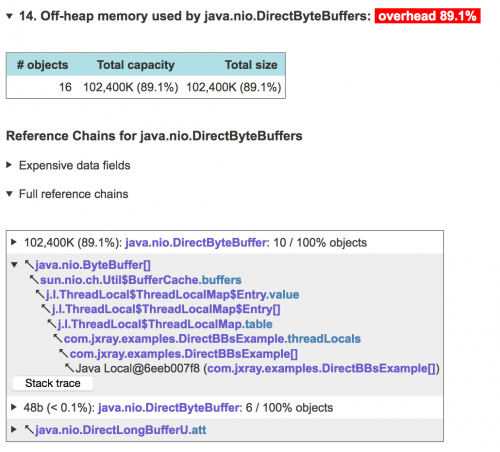
Note that DirectByteBuffers is not the only way for a Java app to utilize off-heap memory. To learn more about the ways that the JVM can use (and waste) native memory, and how to address this problem, read the Troubleshooting Problems with Native (Off-Heap) Memory article.
Humongous (Bigger than 1 MB) Objects
This section is most relevant when your app uses the G1 Garbage Collector. However, very big objects may cause performance of other GCs to suffer as well.
The G1 GC divides the entire heap into the fixed number of same-sized regions. By default, the number of regions is at most 2048, and a region size corresponds to the maximum heap size as follows: heap size < 4GB : 2MB, <8GB : 4MB, <16GB : 8MB and so on. Normally objects are allocated into a given region until it’s full, and then at some point the GC frees up the entire region by evacuating all live objects from it.
All this changes, however, if an object (typically an array) is bigger than half a region size. Such objects are called humongous in G1 terminology, and are handled as follows:
- A humongous object is allocated directly in the Old Generation (note: this may or may not be the case in JDK 11 and newer)
- A separate humongous region is created for each such object by concatenating some number of contiguous regions. For that, some regions may need to be GCed first.
- Each humongous region can accommodate only one humongous object and nothing else. Thus the space between the end of the humongous object and the end of the humongous region (which in the worst case can be close to half the normal region size) is unused. This is true in JDK 8, may or may not be true in JDK 11 and newer.
Further details are available on Oracle’s web site, but from the above description it should be clear that humongous objects are bad, because
- If allocated in the Old Gen, they cannot be GCed quickly even if they are short-lived (the Old Gen is collected less frequently than the Young Gen, and it takes more time)
- Creating a humongous region may need non-trivial amount of time
- If there are many humongous objects on the heap, it can lead to heap fragmentation because of unused “gaps” in humongous regions.
Because of these issues, humongous object allocations may lead to increased GC pauses. And in the worst case, severe heap fragmentation may result in the JVM crashing with OutOfMemoryError. What is especially confusing in such a situation is that a heap dump generated after OOM may be much smaller than the heap size – again, because of heap fragmentation.
To address the problem with Humongous objects, you can try to increase the heap or tune the GC by increasing the region size with -XX:G1HeapRegionSize so that previous Humongous objects are no longer Humongous and follow the regular allocation path. You may also consider switching to JDK 11 or newer, where Humongous objects are handled better. Ideally, though, you should try to fix the root cause, i.e. change your application code so that it doesn’t allocate big objects in the first place.
For more details about Humongous objects, check out this article.
Heap Size Configuration
The HotSpot JVM stores objects in memory in different formats depending on the maximum heap size that you specify via the -Xmx command line option. When the maximum heap size is less than about 32 gigabytes (the so-called “narrow pointer mode”), ordinary instances have a 12-byte header, arrays have 16-byte headers, and each object pointer takes 4 bytes. Otherwise, i.e. when -Xmx is higher than 32GB (“wide pointer mode”), ordinary instances have 16-byte headers, arrays have 20-byte headers, and each object pointer takes 8 bytes. This is necessary for the JVM to support object addresses in really big heaps. But it means that as soon as your -Xmx value crosses the 32GB threshold, objects in your application suddenly become bigger. It may not be a problem if your application works mostly with big primitive arrays – in this case the effect of increased object headers and pointers is often negligible. However, if your application employs many pointer-intensive data structures such as trees, hash maps, etc., or just has many small objects, your memory consumption may suddenly grow more than 1.5 times! For more information, see Why 35GB Heap is Less Than 32GB When JXRay detects that your application uses wide pointers, it calculates how much memory all your objects would use if you switched to narrow pointers by setting -Xmx below the 32GB threshold. It turns out that sometimes savings are big, and your new used heap size will be well below 32GB. In that case, you may be able to greatly reduce memory consumption by just setting -Xmx=31g or less. Keep in mind, however, that the heap dump may not be taken at the moment when your application’s memory utilization is at its peak, and make sure that your new maximum heap size will not cause your application to fail with OutOfMemoryError, or the JVM to run garbage collection too frequently.Thread Stacks
In this section, the stacks for all the threads recorded in the given dump are presented. If one of the threads was caught throwing an OutOfMemoryError, its stack is printed first. For threads with identical thread stacks (this often happens, for example, with listening I/O threads) only one copy of the stack trace is presented. You can still see the names of all the threads with this stack if you click on the header line.