Sample Reports

JXRay analyzes a binary JVM heap dump and generates a report in HTML format. The report contains two main kinds of information:
1. Where the memory goes: by class, by GC root, the JVM heap and native memory, etc.
2. Where the memory is wasted (e.g. duplicate strings, bad collections, etc.)

Below we provide several sample JXRay reports generated from heap dumps publicly available on the web.

Report 1 is for the heap dump in the Apache JIRA ticket NETBEANS-1123. This dump was generated after an OutOfMemoryError. Thus the report presents the thread that threw this exception, with local variables of all the methods on the stack. The main problems that JXRay uncovered in this dump are:

– A potential memory leak

– A very large number of small objects (mainly of types org.netbeans.lib.lexer.token.DefaultToken and byte[]) causing high overhead because of their headers

– A very large number of byte[] arrays with only one element (0). This looks like a bug, or at least a rather ineconomical data representation.

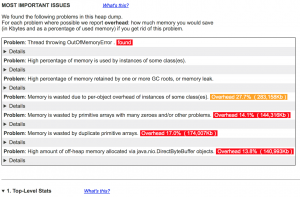
Report 2 is for the heap dump in Apache JIRA HIVE-20153. It displays an OutOfMemoryError. The main problems that JXRay detected are:

– A potential memory leak, or at least a very large number of elements – nearly half a million – in a single HashMap

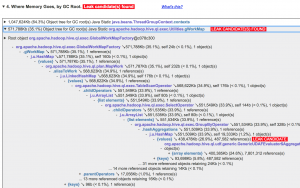
– 68% of the used heap is consumed by byte[] arrays. Furthermore, just one array, referenced by org.apache.hadoop.mapred.MapTask$MapOutputBuffer .kvbuffer data field, takes 1GB of memory, or 64.3% of used heap

– 15% of memory is wasted by empty HashSets. That is the problem that gave rise to the above ticket.

OTHER USEFUL DOWNLOADS

A simple benchmark that compares performance and memory footprint of Guava weak object interner and a custom fixed size array, lock free (FALF) interner.